

 UTAH EDUCATION NETWORK
- PreK-12 Education
Essentials for Teachers
General Resources
Resources by Subject
- Higher Education
Tools for Higher Ed
Resources and Partners

Resources and services for Utah Higher Education faculty and students such as Canvas and collegEmedia. -
Community
Public Libraries
Parents
Career Ed
- Professional Development
UEN Courses
USBE Courses
Tech Discussions
- UEN-TV
Watch UEN-TV
Information
Local Productions

UEN-TV is operated by the Utah Education Network. Our goal is to educate, engage, and enrich the lives of Utah residents through broadcast programs and services. - Distance Education
On-Demand Support
800-863-3496, opt. 1, opt. 1
Mon-Fri 6:00 AM-10:00 PM
Or e-mail us: ivc-ops@uen.orgTraining Resources
- All Training Resources
- IVC Resources
- CMS Web App (CWA)
- WebEx Resources
- Zoom Resources
- Canvas Resources
Additional Info
Tools

The Utah Education Network (UEN) uses various systems and tools to deliver distance education classes to Utah students. - Network
Tech Services
(800) 863-3496Operations Center
801-585-7440
Staff DirectoryUEN Security Office
801-585-9888
Staff DirectoryTechnical Services Support Center (TSSC)
800-863-3496
Staff DirectoryProjects & Services
Network Groups
Network Tools
- About UEN
Information
- CARES Act
- Information Booklet
- Staff Directory
- Network Map
- Jobs
- Technical Advocates
- Software Licensing
Eccles Broadcast Center
101 Wasatch Drive
Salt Lake City, UT 84112(800) 866-5852
(801) 585-6105 (fax)UETN Governance
 Justin
 Braxton
 Dani
Dani Kayla
Kayla Katie
Katie Matthew
 Rob
Rob Val
ValOh, Deer
Summary
This activity allows students to model population fluctuations based on availability of food, shelter and water.
Materials
Attachments
- data recording sheet - 1 per group (attached)
- a large space students can run in
- 10 cards of 4 different colors (cardstock or laminated markers last longer)
- 4 trays to put the colored markers in clipboard and whistle(for the teacher)
Background for Teachers
In a natural functioning system, populations of organisms rise and fall in a dynamic balance. Some animals have well documented cycles (11 year cycles for rabbits) while others are less clear. Many students have misconceptions surrounding the effect of predators on populations, thinking that they are the only reason prey populations decrease. Prey animal populations decline because of lack of food rather than because of predation.
Instructional Procedures
Attachments
- Choose a student to be the data recorder.
- Handout the colored paper markers to students.
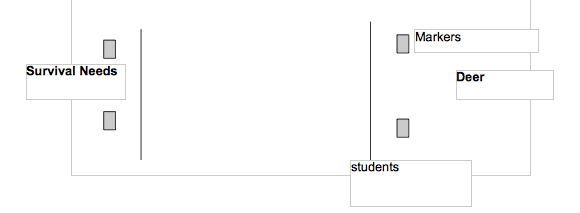
- Walk students outdoors and pick 10 to start as "deer" and line up in a row. See illustration here.
- Have all the other students walk 20 meters away and form another line facing the "deer". They should also turn their backs to the deer.
- When you blow the whistle, student should turn around and the "deer" run to the "needs" and stand in front of a matching color marker to their own.
- The matching pairs of students should both walk over to the "deer" side and line up again. Any student that did not find a matching marker should stay on the "needs" side. The student recorder should write down the number of deer that survived.
- Continue to play as many rounds as possible to get consistent data. Students may change the color of their markers before any round begins.
Bibliography
Lesson Design by Jordan School District Teachers and Staff
Updated: 02/03/2018