IMMIGRATION TO UTAH
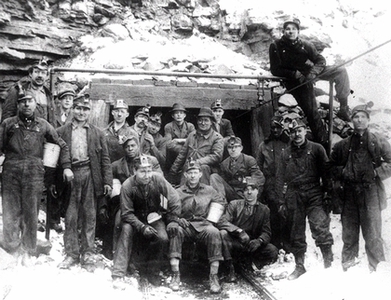
Miners of various ethnic groups, Castle Dale
Everyone who has migrated to Utah from another area is, in a sense, an immigrant. By the early 1990s more than 200,000 individuals had left their native lands with Utah as their destination, and thousands more had moved to Utah after initial settlement elsewhere in the United States or Canada. Spanish explorers and French-Canadian, British, and Canadian fur traders had briefly sojourned in Utah before 1847; but it was in that year that Mormon immigrants from Britain, Canada, Denmark, and Norway, who were among the vanguard of the Mormon exodus from Illinois, became the first non-Native American immigrants to Utah. After securing a precarious foothold in Salt Lake Valley and helping move their Nauvoo refugees to Utah, Brigham Young and the Mormons turned much of their attention to proselytizing abroad and gathering converts to their new Zion. The vast majority of the convert immigrants settled in present-day Utah, although several thousand also moved on to help establish communities in present-day Idaho, Wyoming, Arizona, New Mexico, Colorado, and Wyoming. Recruits from abroad were a major component of the Saints' attempt to establish temporal control over the area which sociologists would later dub the Mormon Culture Region.
The Mormons' thorough organization of every phase of the immigration process helped their immigrants avoid many of the troubles commonly experienced by others and facilitated the immigration of families. The Latter-day Saint Church also marshaled its resources to assist those unable to afford the cost of emigration. One vehicle for this aid was the Perpetual Emigrating Fund Company. Utilizing donations and church resources, the fund directly assisted some 26,000 immigrants from Europe between 1852 and 1887, about 36 percent of the Latter-day Saints who immigrated to the Great Basin region in that period.
Approximately 50,000 Latter-day Saints from the British Isles and 30,000 from Scandinavia immigrated to the Intermountain West by the beginning of the twentieth century. Smaller numbers came from Germany, Switzerland, the Netherlands, Italy, and France. Australia and the islands of the South Pacific provided a few more. In Utah they joined several thousand, primarily from the British Isles, who had immigrated to the United States prior to the Mormon exodus to the West.
The decade with the greatest influx of immigrants to Utah was the 1860s, with the result that in 1870 more than 35 percent of all Utah residents had been born in foreign countries. Immigrants' children soon outnumbered the immigrants themselves, and immigrants and their children made up two-thirds of Utah's population in 1890.
In the 1890s the Latter-day Saints turned from their concentration on building a theocratic commonwealth toward fitting into American society. They promoted the concept of the "gathering" much less aggressively, particularly at times when Utah's economy was relatively depressed and provided fewer opportunities for newcomers. But for several decades Mormons abroad received mixed signals. Finally, by the 1960s converts from abroad were consistently encouraged to remain in their homelands to build the church there.
The first companies of Latter-day Saints to settle Utah included a few non-Mormons, but it was not until the construction of the transcontinental railroad across Utah in 1868-69 that substantial numbers of non-Mormon immigrants began to find their way to Utah. Many Chinese construction workers on the railroad remained in Utah for years, some as railroad maintenance personnel. Irish-born Patrick Edward Connor, commander of the U.S. Army's Fort Douglas on the outskirts of Salt Lake City, spearheaded exploration for mineral wealth in the 1860s and 1870s, hoping that the development of a mining industry would help attract enough Gentiles (non-Mormons) to Utah to "Americanize" the territory. In many ways his strategy worked, with immigrants playing a major role. Irish, Cornish, and Welsh miners were among the first to man Utah's mineral industry. During the 1890s the "new immigration" from southern and eastern Europe played an increasingly important role in Utah, particularly in the mining industry and railroads.
The early years of the twentieth century were volatile for immigration as well as for labor. Utah's mines, mills, and railroads made use of the services of labor agents to recruit workers from abroad. The most influential were Leonidas Skliris from Greece and Daigoro Hashimoto from Japan. Each arranged for thousands of his countrymen to immigrate to Utah; Hashimoto also arranged for Korean workers, and Skliris served as agent for Serbians, Albanians, and Lebanese immigrants as well. Largely through the influence of Skliris, Wyoming, Nevada, and Utah had the highest concentration of Greeks in the nation in proportion to their total populations in 1910. Southern Slavs and Greeks from Crete were particularly active in labor unions, and strikes and ethnic conflict were common during this period. Serbs and Croatians renewed old rivalries; striking Cretans clashed with strikebreakers brought in from the Greek mainland. Relations between the newcomers and their more established Mormon neighbors were sometimes less than cordial. Also the anti-immigrant activities of the Ku Klux Klan reached their peak in Utah in 1924-25 with cross-burnings, parades, and threats.
Most immigrants in the nineteenth and twentieth centuries came to America intending to return to their homelands after earning enough in America to buy land or otherwise improve their economic status back home. In the years from 1908 to 1920 about 5,000 persons born in southern Europe returned to their native lands directly from Utah. More than 3,000 of these were returning to Greece, and nearly 2,000 to Italy. Comparing the average number immigrating to Utah annually from 1903 to 1920 with the average number emigrating from Utah from 1908 to 1920, Greeks emigrated at a rate three-fourths as high as they immigrated. For southern Italians the return rate was 49 percent; northern Italians 30 percent; Croatians and Slovenians 46 percent; English 8 percent; and Germans 4 percent.
Latter-day Saint immigrants were encouraged to assimilate with other fellow believers, and few Utah localities were exclusively settled by one national or ethnic group. An exception was a church-sponsored Hawaiian agricultural colony, Iosepa, in Skull Valley from 1889 to 1917. The short-lived (1911-1916) Jewish agricultural colony of Clarion, Sanpete County, was a rare non-Mormon settlement inhabited exclusively by Jewish immigrants, primarily from Russia, and their children. Elsewhere, immigrants often tended to concentrate in particular neighborhoods within larger communities. In Bingham Canyon alone there were the perjoratively nicknamed Greek Town, Jap Town, Bohunk Town (South Slavs), and Frog Town (French-Canadians). Ethnic community, fostered by benevolent and fraternal societies, newspapers, coffeehouses, boardinghouses, and sometimes churches, was only temporary for many groups, given the booms and busts of the mining industry which provided the major employment for many. However, Greek and Japanese schools helped preserve those languages and cultures in Utah, providing a permanence others lacked.
Theodore Roosevelt's "Gentlemen's Agreement" of 1907 limiting Japanese immigration, World War I, the passing of restrictive immigration laws beginning in the 1920s, a depressed Utah economy in the 1920s, the Great Depression of the 1930s, and World War II all contributed to a decline of immigration to Utah. On the other hand, Utah became a temporary home for four years during World War II for some 8,000 Japanese Americans who were interned at the dusty Topaz relocation camp in Millard County, while ninety voluntary Japanese American evacuees from California established an agricultural colony at Keetley, Wasatch County. Many, but not most, of the Japanese internees remained in Utah after they were allowed to leave Topaz.
Despite significant immigration from southern and eastern Europe early in the twentieth century, immigrants from northern and western Europe remained most numerous in Utah, joined after World War II by Canadian immigrants. A resurgence of Mormon immigration followed that war--more than 24,000 had immigrated by 1959, many of them settling in Utah. To combat overcrowding in the Netherlands, the Dutch government offered financial assistance to emigrants, resulting in an unprecedented volume of Dutch immigration to Utah. In 1970 Utah was the only state in which the United Kingdom was the leading country of origin for immigrants and their children, accounting for 2.7 percent of the state's population, followed by 1.3 percent from Germany and 1.1 percent from Canada.
Utah's Hispanic population grew between 1910 and 1930, primarily with immigration from Mexico, then dwindled during the Depression of the 1930s. Its ranks began to swell again beginning with World War II, but a higher proportion have come to Utah from Colorado and New Mexico than from Mexico.
The 1970s and 1980s saw a renewed surge of immigration to Utah, including the resettlement of refugees from Southeast Asia. In the period 1980 to 1986 Utah ranked behind only Washington, D.C., California, and Washington state in the number of Southeast Asian refugees resettled in proportion to its 1980 population. A total of 9,123 people were resettled in Utah during those years. Significant numbers from Latin America and from the South Pacific also settled in Utah.
Immigrants and their children maintained the language and cultural heritage of their native lands to a limited degree, while most became an integral part of the larger society and acquired fluency in English. The 1990 federal census indicated that approximately 120,400 Utah residents over the age of five spoke a language other than English in the home. Of these, 87 percent also spoke English "well" or "very well." Most of those maintaining the use of the mother tongue were immigrants and their children, although some were Native Americans and Hispanic families with deep roots in the American Southwest. Spanish was spoken at home by nearly 52,000 persons, and German by more than 11,000.
More than 25,000 foreign-born residents of Utah were naturalized between 1907 and 1984. Statistics are lacking for the years 1941 to 1948, which would bring the total still higher. In 1980 approximately two-thirds of the foreign-born residents of Utah had been naturalized.
Utah is unique in the United States in the extent to which members of one religious denomination became and continued to be numerically predominant. While Latter-day Saints were the largest group of early Utah settlers, it seemed reasonable to many to anticipate, with Patrick Connor, that in-migration from the nation and the world would eventually make the Mormons a minority. Indeed, the sustained influx of non-Mormons has had significant influences on the state. But after reaching a nadir of 60 percent of the state's population in 1920, the Mormons have comprised at least 70 percent of its growing population since 1960. Several factors contribute to this. Latter-day Saints have a higher birthrate than their neighbors, are less likely to leave Utah, and increase their numbers locally by proselytizing. Immigration, once a major factor in Mormon predominance, continues, albeit in a more subdued role, as a limited number of Latter-day Saints from abroad continue to join fellow believers from within the United States in moving to Utah.
UTAH'S FOREIGN-BORN POPULATION, 1860-1980
| Country | 1850 | 60 | 70 | 80 | 90 | 1900 | 10 | 20 | 30 | 40 | 50 | 60 | 70 | 80 | 90 |
| Afghanistan | 28 | ||||||||||||||
| Albania | 4 | 19 | |||||||||||||
| Argentina | 28 | 123 | 233 | 463 | |||||||||||
| Australia | 10 | 74 | 133 | 118 | 161 | 199 | 221 | 215 | 158 | 224 | 190 | 424 | |||
| Austria | 3 | 51 | 4 | 22 | 109 | 240 | 1870 | 987 | 410 | 465 | 500 | 441 | 268 | 292 | 250 |
| Azores | 1 | 2 | 14 | 16 | 28 | ||||||||||
| Bahamas | 14 | ||||||||||||||
| Barbados | 1 | 21 | |||||||||||||
| Belgium | 2 | 5 | 13 | 29 | 74 | 90 | 79 | 71 | 134 | 232 | 112 | 214 | 160 | ||
| Belize | 6 | ||||||||||||||
| Bohemia | 3 | 3 | 8 | 13 | |||||||||||
| Bolivia | 12 | 160 | |||||||||||||
| Brazil | 78 | 7 | 268 | 591 | |||||||||||
| Bulgaria | 81 | 30 | 37 | 27 | 16 | 12 | |||||||||
| Burma | 39 | ||||||||||||||
| British Honduras | 20 | 54 | |||||||||||||
| Cambodia | 846 | ||||||||||||||
| Canada | 338 | 647 | 687 | 1036 | 1222 | 1331 | 1694 | 146 | 1196 | 1436 | 2145 | 2256 | 2599 | 5132 | 5459 |
| Chile | 43 | 49 | 425 | ||||||||||||
| China | 1 | 446 | 502 | 808 | 544 | 312 | 250 | 214 | 108 | 287 | 612 | 877 | 1667 | ||
| Colombia | 12 | 15 | 238 | 351 | |||||||||||
| Costa Rica | 21 | 125 | |||||||||||||
| Cuba | 92 | 1 | 2 | 1 | 4 | 1 | 4 | 62 | 100 | 159 | |||||
| Country | 1850 | 60 | 70 | 80 | 90 | 1900 | 10 | 20 | 30 | 40 | 50 | 60 | 70 | 80 | 90 |
| Czechoslovakia | 163 | 119 | 65 | 81 | 112 | 148 | 136 | 321 | |||||||
| Denmark | 2 | 1824 | 4957 | 7791 | 9023 | 9132 | 8300 | 6970 | 4883 | 3158 | 2240 | 1665 | 1185 | 998 | 666 |
| Dominican Rep. | 7 | 39 | 82 | ||||||||||||
| Ecuador | 4 | 24 | 50 | 139 | |||||||||||
| Egypt | 72 | 88 | |||||||||||||
| El Salvador | 4 | 7 | 171 | 440 | |||||||||||
| England | 1056 | 7084 | 16073 | 19654 | 20899 | 18879 | 18082 | 14836 | 10851 | 7190 | 5712 | 4815 | 3554 | 3551 | |
| Estonia | 3 | 17 | |||||||||||||
| Finland | 734 | 1012 | 779 | 507 | 309 | 217 | 169 | 153 | 149 | 209 | |||||
| France | 13 | 21 | 63 | 129 | 205 | 220 | 303 | 434 | 261 | 184 | 248 | 359 | 257 | 725 | 440 |
| Germany | 56 | 107 | 358 | 885 | 2121 | 2360 | 3963 | 3589 | 4104 | 3353 | 3334 | 5585 | 4890 | 5950 | 4949 |
| Ghana | 16 | ||||||||||||||
| Greece | 1 | 2 | 3 | 3 | 4039 | 3029 | 2197 | 1882 | 1682 | 1537 | 1046 | 960 | 615 | ||
| Guatemala | 35 | 68 | 142 | 366 | |||||||||||
| Guyana | 11 | 22 | |||||||||||||
| Haiti | 15 | 32 | 5 | 25 | |||||||||||
| Honduras | 4 | 6 | 191 | ||||||||||||
| Hong Kong | 270 | 235 | |||||||||||||
| Hungary | 1 | 7 5 | 23 | 33 | 171 | 179 | 72 | 78 | 99 | 79 | 119 | 68 | 9 | ||
| Iceland | 97 | 49 | 31 | 13 | |||||||||||
| India | 17 | 15 | 23 | 91 | 149 | 456 | 771 | ||||||||
| Indonesia | 238 | ||||||||||||||
| Iran | 1122 | 979 | |||||||||||||
| Country | 1850 | 60 | 70 | 80 | 90 | 1900 | 10 | 20 | 30 | 40 | 50 | 60 | 70 | 80 | 90 |
| Iraq | 42 | ||||||||||||||
| Ireland | 106 | 278 | 502 | 1321 | 2045 | 1516 | 1656 | 1207 | 584 | 362 | 320 | 139 | 91 | 152 | 164 |
| Israel | 24 | 33 | 119 | 145 | |||||||||||
| Italy | 1 | 40 | 74 | 138 | 347 | 1062 | 3117 | 3225 | 2814 | 2189 | 1750 | 1437 | 831 | 758 | 653 |
| Jamaica | 8 | 14 | 20 | 56 | |||||||||||
| Japan | 5 | 419 | 2062 | 2359 | 1730 | 829 | 1049 | 678 | 1213 | 1801 | |||||
| Jordan | 56 | ||||||||||||||
| Korea | 13 | 87 | 61 | 187 | 1148 | 1659 | |||||||||
| Laos | 1406 | ||||||||||||||
| Latvia | 15 | 9 | 8 | 3 | 47 | 22 | |||||||||
| Lebanon | 20 | 53 | 139 | 110 | |||||||||||
| Lithuania | 12 | 36 | 17 | 24 | 7 | 13 | 33 | 6 | |||||||
| Luxembourg | 5 | 2 | 3 | 18 | 9 | 5 | 4 | ||||||||
| Malaysia | 44 | ||||||||||||||
| Malta | 1 | ||||||||||||||
| Mexico | 7 | 12 | 8 | 17 | 19 | 41 | 145 | 1083 | 2386 | 1069 | 1396 | 1153 | 1308 | 4221 | 8922 |
| Morocco | 73 | ||||||||||||||
| Netherlands | 1 | 122 | 141 | 254 | 523 | 1392 | 1980 | 2325 | 1857 | 2336 | 3905 | 2640 | 3009 | 2204 | |
| New Zealand | 104 | 91 | 418 | ||||||||||||
| Nicaragua | 12 | 76 | |||||||||||||
| Nigeria | 117 | ||||||||||||||
| Norway | 32 | 159 | 613 | 1214 | 1854 | 2128 | 2304 | 2109 | 1698 | 1166 | 1236 | 967 | 724 | 718 | 586 |
| Northern Ireland | 234 | 93 | 31 | 95 | 83 | 36 | |||||||||
| Country | 1850 | 60 | 70 | 80 | 90 | 1900 | 10 | 20 | 30 | 40 | 50 | 60 | 70 | 80 | 90 |
| Pakistan | 15 | 35 | 154 | ||||||||||||
| Palestine | 5 | 10 | 15 | ||||||||||||
| Panama | 22 | 6 | 100 | ||||||||||||
| Peru | 30 | 68 | 215 | 756 | |||||||||||
| Philippines | 158 | 197 | 238 | 631 | 1106 | ||||||||||
| Poland | 2 | 11 | 16 | 20 | 65 | 240 | 230 | 135 | 148 | 151 | 135 | 184 | 521 | ||
| Portugal | 1 | 2 | 4 | 26 | 8 | 8 | 4 | 8 | 5 | 5 | 7 | 5 | 36 | ||
| Rumania | 1 | 18 | 69 | 64 | 42 | 22 | 21 | 7 | 36 | 124 | |||||
| Russia | 1 | 13 | 54 | 290 | 119 | 568 | 684 | 342 | |||||||
| Sandwich Islands | 10 | 30 | 156 | ||||||||||||
| Sardinia | 19 | ||||||||||||||
| Saudi Arabia | 18 | ||||||||||||||
| Scotland | 232 | 1228 | 2391 | 3201 | 3474 | 3143 | 2853 | 2310 | 1669 | 1044 | 780 | 572 | 611 | 520 | |
| Serbia | 251 | ||||||||||||||
| South Africa | 50 | 160 | 203 | ||||||||||||
| Spain | 1 | 5 | 2 | 76 | 12 | 8 | 24 | 250 | 277 | 131 | 137 | 134 | 187 | 164 | 268 |
| Sweden | 1 | 196 | 1790 | 3750 | 5986 | 7025 | 7227 | 6073 | 4389 | 2832 | 2092 | 1316 | 842 | 779 | 538 |
| Switzerland | 1 | 78 | 509 | 1040 | 1336 | 1469 | 1691 | 1566 | 1419 | 1071 | 972 | 870 | 566 | 548 | 315 |
| Syria | 174 | 141 | 122 | 20 | 84 | ||||||||||
| Taiwan | 924 | ||||||||||||||
| Thailand | 503 | 581 | |||||||||||||
| Trinidad and Tobago | 20 | 21 | |||||||||||||
| Trust Terr. Pacific | 13 | ||||||||||||||
| Country | 1850 | 60 | 70 | 80 | 90 | 1900 | 10 | 20 | 30 | 40 | 50 | 60 | 70 | 80 | 90 |
| Turkey | 86 | 2 | 18 | 361 | 30 | 39 | 33 | 49 | 50 | 64 | 95 | ||||
| USSR |
286 | 231 | 229 | 191 | 554 | 529 | |||||||||
| United Arab Republic | 86 | 7 | |||||||||||||
| United Kingdom | 3957 | ||||||||||||||
| Uruguay | 32 | 151 | 70 | ||||||||||||
| Venezuela | 3 | 29 | 173 | ||||||||||||
| Vietnam | 1732 | 2562 | |||||||||||||
| Wales | 125 | 945 | 1783 | 2390 | 2387 | 2141 | 1672 | 1304 | 862 | 377 | 181 | 183 | 79 | ||
| Yugoslavia | 836 | 989 | 661 | 496 | 305 | 283 | 180 | 149 | |||||||
| Other Atlantic Islands | 40 | 8 | 2 | 5 | 3 | 2 | 2 | 8 | |||||||
| Other Great Britain | 5 | 23 | 13 | 6 | |||||||||||
| Other Pacific Islands | 7 | 78 | 149 | 55 | 307 | 2606 | |||||||||
| (Other) West Indies | 2 | 3 | 7 | 9 | 5 | 2 | 7 | 4 | 4 | 28 | 14 | 26 | |||
| (Other) Africa | 17 | 128 | 106 | 77 | 97 | 46 | 35 | 793 | 207 | ||||||
| (Other) Asia | 1 | 16 | 1 | 12 | 8 | 21 | 59 | 56 | 444 | 97 | 286 | 2850 | 308 | ||
| Other Southwest Asia | 116 | ||||||||||||||
| Other Western Asia | 195 | ||||||||||||||
| Other America | 185 | ||||||||||||||
| Central America | 1 | 5 | 19 | 1 | 2 | 2 | 4 | ||||||||
| Other Europe | 2 | 8 | 22 | 20 | 8 | 17 | 136 | 75 | 112 | 13 | 6 | 81 | |||
| Other N. & C. America | 363 | 10 | |||||||||||||
| (Other) South America | 3 | 12 | 15 | 7 | 11 | 28 | 39 | 33 | 12 | 34 | 634 | 26 | |||
| Other | 10 | 1 | 15 | 215 | 666 | 274 | 222 | 406 | 2832 | 114 | |||||
| Born at Sea | 21 | 23 | 53 | 76 | 41 | 40 | 31 | 2 | |||||||
| Not reported | 66 | 1 | 329 | 338 | 2260 | 2484 | 1436 | ||||||||
| Total foreign born | 2044 | 12754 | 30702 | 43994 | 53064 | 53777 | 65767 | 59067 | 48178 | 33235 | 29844 | 32133 | 29573 | 50451 | 58600 |
| Total population | 11380 | 40273 | 86786 | 143963 | 207905 | 276749 | 373351 | 449396 | 507847 | 550310 | 688862 | 8906273 | 1059273 | 1461037 | 1722850 |
| Foreign born percent | 18 | 32 | 35 | 31 | 26 | 19 | 18 | 13 | 9 | 6 | 4 | 4 | 3 | 3 | 3 |
Note: These statistics were compiled from US Census publications. Because changes in boundaries and jurisdictions were too numerous to explain here, the statistics should be used with caution. Beginning in 1910 the census publications reported the country of origin only for "foreign-born whites" and not for those who were considered "nonwhite." For the years 1910-1940 I have arbitrarily listed foreign-born Chinese, Japanese, Koreans, and Filipinos as having been born in China and Japan, respectively. I have not attempted to guess at place of birth for any other "nonwhites" for that period, who totalled 55 in 1910; 136 in 1920; 92 in 1930, and 41 in 1940. The 1950 census publications provide no listing of place of birth for the 1,625 foreign-born "nonwhites," making it impossible to include them here. England and Wales are combined under England for 1950. Beginning in 1950, census figures were based on samples.