

 UTAH EDUCATION NETWORK

 Justin
 Braxton
 Dani
Dani Kayla
Kayla Katie
Katie Matthew
 Rob
Rob Val
Val


News

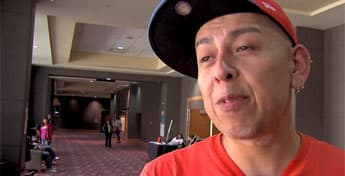
This Students In Focus Season One Finale features a student spotlight on Gabi Cuascut, a rising producer from Utah Valley University, and expert insights from filmmaker Nic Edwards, a skilled 1st Assistant Camera and camera operator.
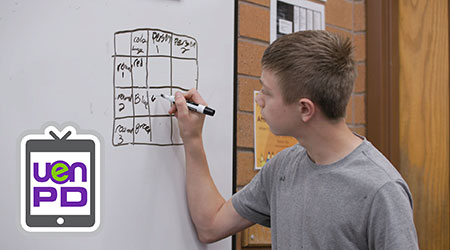
In this episode of UEN's PDTV, we explore strategies to discover high-quality digital resources aligned with Utah Core Standards beyond basic Google searches and expensive educational websites.


Watch
UEN-TV

Unadopted
After 20 years in foster care, Noel Anaya claimed his independence in court at age 21. UNADOPTED follows Noel on his quest for answers about his...

FNX
Indian Road
"Indian Road" is a magazine-style TV show featuring engaging stories from Indian Country produced by Cheyenne and Arapaho Television. The show's...
NHK World-Japan

Gifts from the North
Leaving a popular Tokyo restaurant, Otsuka Kenichi and his wife Keiko relocated to Hokkaido Prefecture six years ago. There, they offer enticing,...